Let’s put aside increasing interest rates and volatile markets and analyze what is happening right here in St. James.
I recently compared two consecutive 12-month periods of closed home sales, from September 30, 2024, to October 1, 2025 and September 30, 2025, to October 1, 2026. I focused strictly on single-family homes, leaving condominiums, townhomes, and vacant home-sites out of the mix so we’re comparing similar types of properties.
And I have to say, the numbers are pretty interesting.
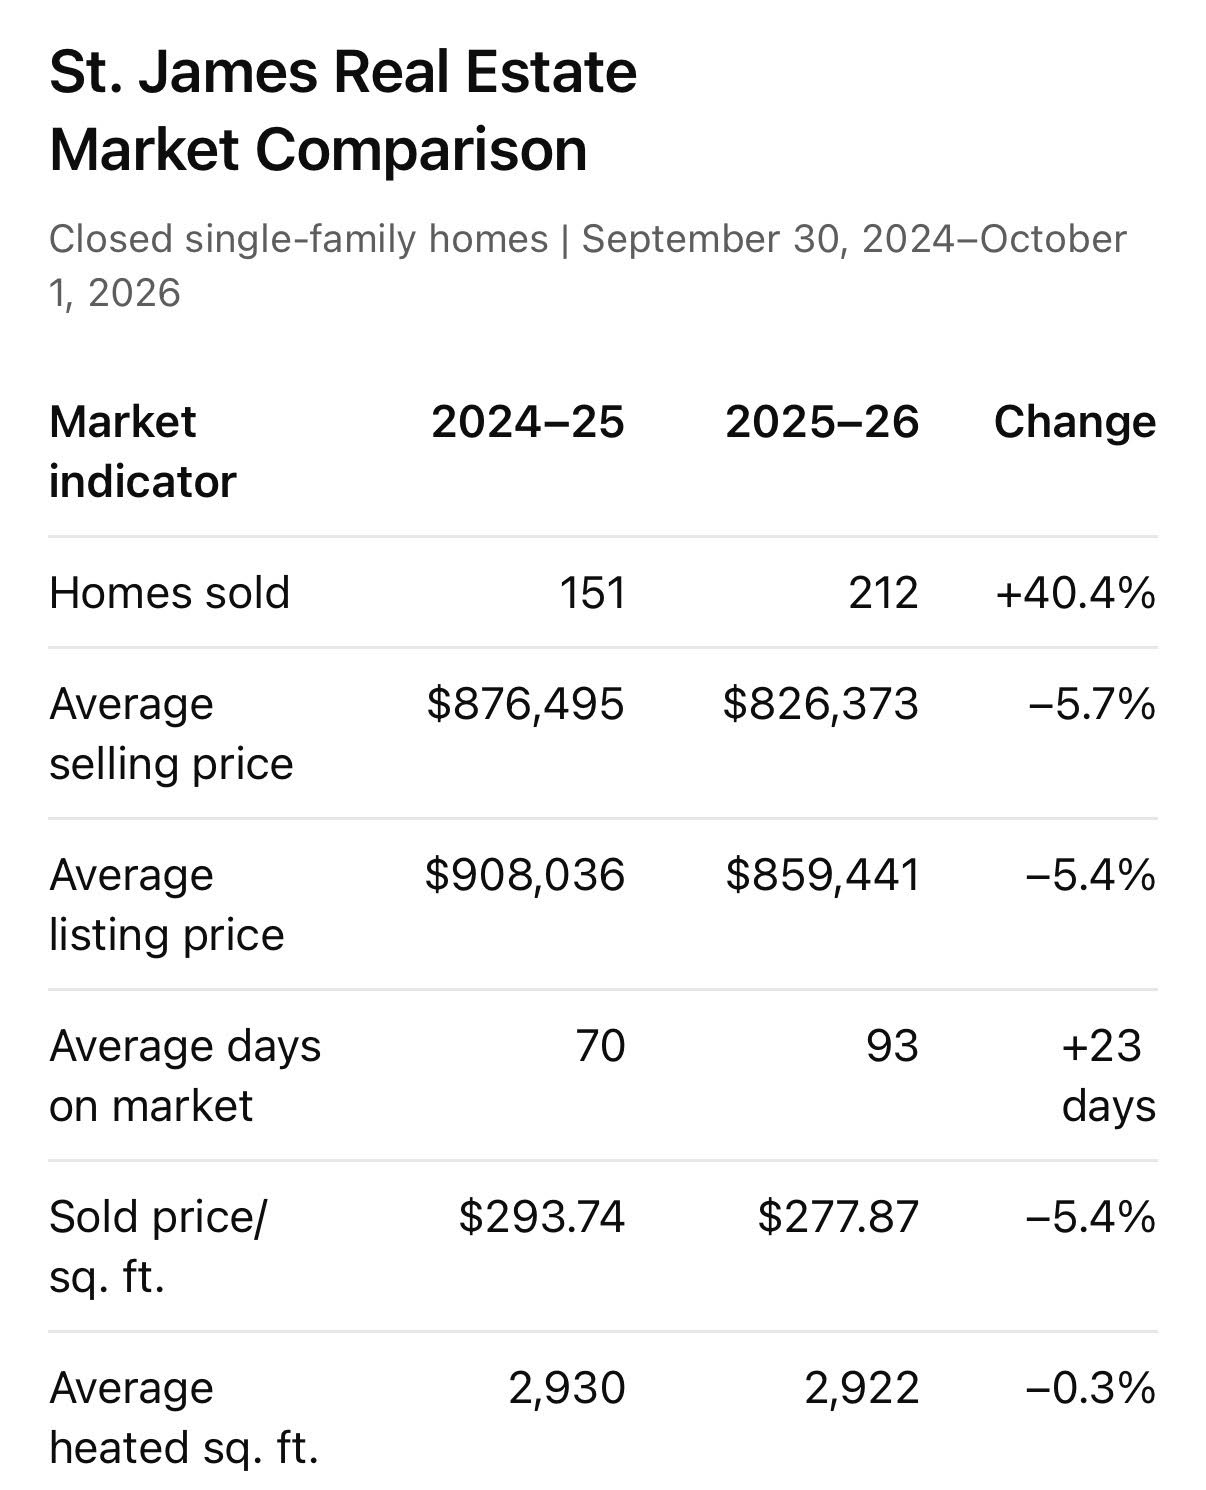
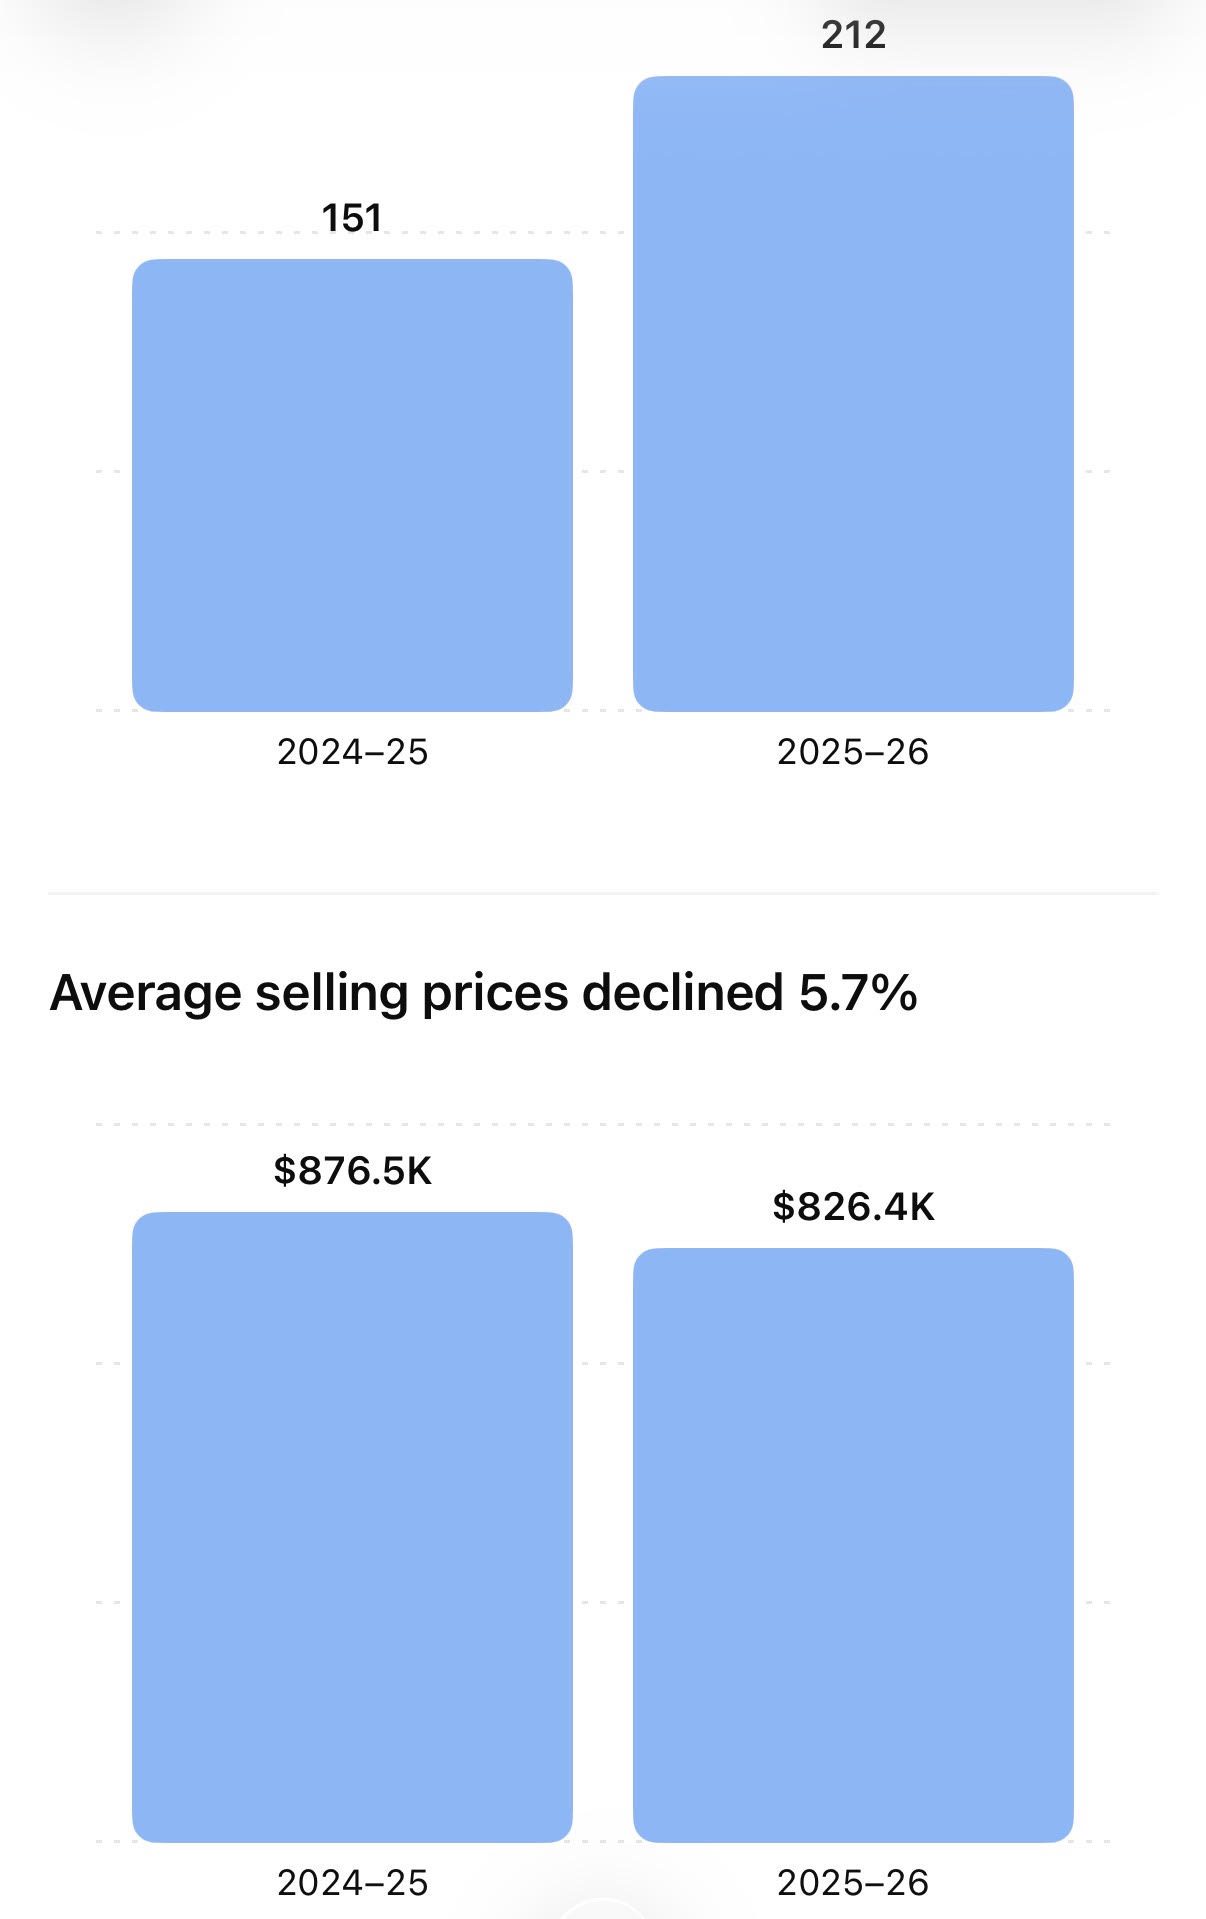
During the first period September 30, 2024, to October 1, 2025, 151 homes sold in St. James, with an average selling price of $876,495. During the most recent period, 212 homes sold, an increase 61 more sales equaling more than 40% growth.
That’s great news! Buyers are still buying, and St. James continues to be a very desirable place to live.
But here’s where things get interesting.
Even with that increase in sales, the average selling price dropped from $876,496 to $826,373, a decline of approximately 5.7%. The average price per heated square foot also declined, from $293.74 to $277.87.
And homes are taking longer to sell. Average days on market increased from approximately 70 days to 93 days.
So what does all this mean?
First, I certainly don’t see any reason for doom and gloom. We’re not looking at a market where buyers have disappeared. Quite the opposite, actually.
What I believe we’re seeing is a market that is gradually adjusting after several years of unusually strong appreciation and intense buyer competition.
Buyers today tend to be more selective. They’re comparing homes, paying closer attention to condition and updates, and they’re not necessarily jumping at the first property they see.
For sellers, that means pricing your home correctly from the beginning is becoming increasingly important. The days of simply putting a house on the market at an ambitious price and expecting multiple offers aren’t something we should count on.
One interesting detail worth mentioning is that the average size of homes sold during these two periods was nearly identical, approximately 2,930 heated square feet. So while every home is different, we’re not simply comparing a year of smaller homes against a year of substantially larger ones.
Of course, averages don’t tell the whole story. Golf course views, pond views, location, condition, floor plans and updates can make a tremendous difference in value.
My takeaway?
St. James remains a very active real estate market. More homes are selling, but they’re taking a little longer, and average prices have softened.
That’s not necessarily bad news. It’s simply a reminder that markets change.
And whether you’re buying, selling or just enjoying life here in St. James, understanding what’s happening in our own backyard is far more useful than listening to another national real estate headline.
If you would like a year-to-year breakdown with specific price points, heated square ft. etc. just let me know.
Data source:
Brunswick County Association of Realtors, FlexMLS Database (Closed data extracted 10/08/2026), https://www.flexmls.com
Any content, resident submissions, guest columns, advertisements, and advertorials are not necessarily endorsed by or represent the views of Best Version Media LLC (BVM) or any municipality, homeowners associations, businesses, or organizations that this publication serves. BVM is not responsible for the reliability, suitability, or timeliness of any content submitted, inclusive of materials generated or composed through artificial intelligence (AI). All content submitted is done so at the sole discretion of the submitting party.